http://proceedings.esri.com/library/userconf/proc99/proceed/papers/pap171/p171.htm
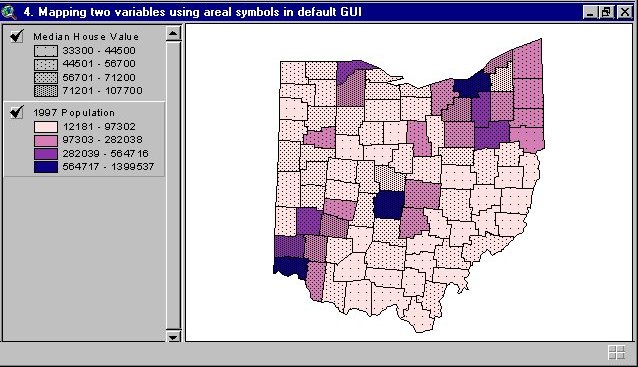
This is a Bivariate map of Ohio that tells a story of median house value in the counties of Ohio. Notice that areas int he southeast part of the state have some of the most expensive homes in the region. This is the the northern part of Cincinatti.What makes this a bivariate Chloropleth map is that it has two factors being showed on the same map. Enjoy!!!
No comments:
Post a Comment